Understanding your data is the key to making informed business decisions, but it does not have to be complex. For many companies, customer behavior, sales, and even operational metrics often follow predictable patterns.
One of the most valuable patterns is found in the Normal Distribution curve. Let us explore how application of the Normal Distribution on your company’s data can help with making smarter decisions regarding pricing, as an example.
The Normal Distribution Curve
The Normal Distribution Curve, often referred to as the "Bell Curve," shows that data clusters around a central average (mean) and the spread measured by standard deviation allows for reliable patterns to emerge. Whether your data is related to customer purchases, sales volume, website traffic, or revenue sources for your business, the core distribution patterns can be presented in a comparable manner. For instance, they can pinpoint where your core business profitability lies, where your decisions need to make a bigger difference, and helps you to spot what falls outside normal or expected ranges in your business.
For example, consider customer spending for a product:
68% of customers tend to spend within a "normal" range (one standard deviation from the average).
96% of customers fall within two standard deviations, while
The remaining 4% are either those who spend very little or spend a lot more as compared to others on a product.
Watch the following short video for a visual representation of the example:
The workshop on Oct. 17th can improve your data literacy. Limited Spots Available. Register now to claim your spot.
Example: Pricing Model for SaaS/AI Tools
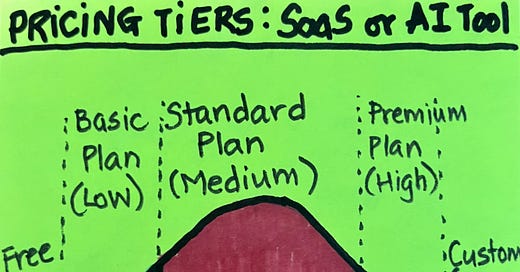
A SaaS startup called TechSol offers three subscription plans for its clients. These tiers are broken up into “Basic”, “Standard”, and “Premium” tiers. Unless you have been living under a rock for the past 3 years and have never used a single online AI or SaaS tool, you know that the 3-tier pricing model is pretty standard in the industry.
Understanding Customer Spending:
Analyzing revenue and purchase data from TechSol reveals that about 68% of their customers purchase the Standard plan, which represents the "normal" range of spending (one standard deviation from the mean).
The Basic plan appeals to around 14% of their customers (the lower end), while Premium captures around 14% of customers (the higher end).
Incorporating Extremes:
The 2% of customers at the lower end may be seeking a free or lower-cost tier and demonstrate higher churn rates but very low contribution to revenues.
The other 2% at the upper end represent high spenders who require customized enterprise solutions and drive significant revenues even though they do not fall into a specific tier or plan.
These cases provide insights that can influence the pricing strategy and product development, even if they do not represent the majority of the customers because they have impact on revenues and sustainability of the company.
Strategic Insights:
By focusing your marketing and product development efforts on the Standard plan, you cater to the majority of your customers, maximizing revenue.
Consider offering additional features in the Premium plan to attract high spenders and provide upgrades for your Basic plan to better meet the needs of lower-tier customers.
Analyzing feedback from the customers at either extreme of the distribution can also help identify potential new features or products that could capture additional market segments.
Actionable Decisions:
Understanding this distribution allows you to set targeted pricing strategies, anticipate churn rates, and adjust your marketing efforts effectively. You can also explore opportunities for upselling or creating customized offerings for both ends of the spectrum.
Why You Should Care
Business owners or leaders: The Normal Distribution curve provides a clear way to identify trends, optimize pricing, and align product offerings with customer behavior in your business or department.
AI startups: Utilizing this curve is critical when building algorithms that rely on understanding customer data, behaviors, and market trends. Instead of catering heavily to the Basic Plan or Premium Plan customers, it is better to strategize in the initial stages to capture the imagination of the Medium Plan customers. This requires careful analysis of how price-elastic your product is likely to be, in order to set the prices for the tiers.
How A Data Science Expert Can Help You
Data Scientists work with business leaders and AI startups to provide clear, actionable insights from complex data sets.
#PostitStatistics #DataScience #AI
If you're ready to simplify your data and start making better business decisions, let’s talk. Reach out today for a Free Consultation to explore how we can transform your data into profit-driving insights.
Follow Dr. Kruti Lehenbauer or Analytics TX, LLC on LinkedIn. DM me for more information.


